Each MED (Mean/Median Energy Distribution) file contains two columns
The mean, median and percentiles are calculated incorporating upper limit data by using Kaplan-Meier estimates (censored statistics) as described in the paper.
Files with names beginning with LMED represent the MED normalized with the UVOIR luminosity as in Fig 37b.
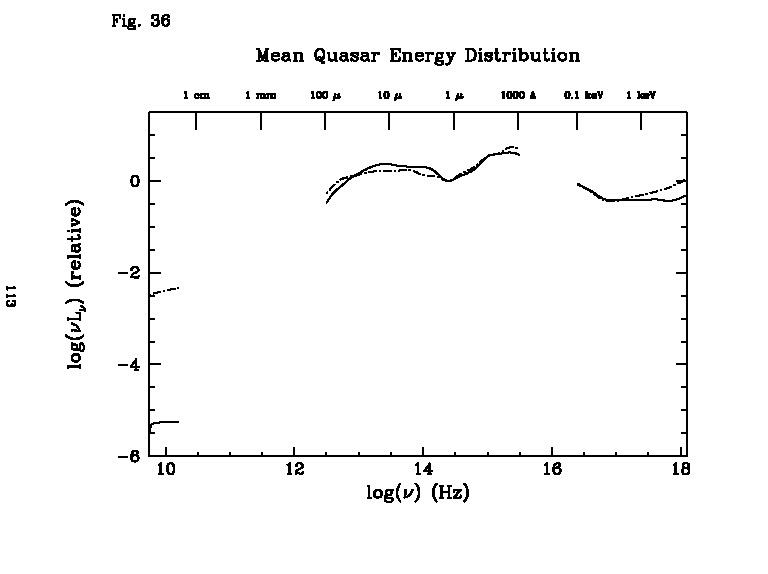
Fig. 36. The mean quasar energy distribution, normalized at 1.5 microns, for radio-loud (dashed line) and radio-quiet (solid line) quasars. Spectral regions where little or no data are available are omitted. The radio-loud distribution has a rising x-ray spectrum in this plot, while the radio-quiet x-ray spectrum is horizontal.
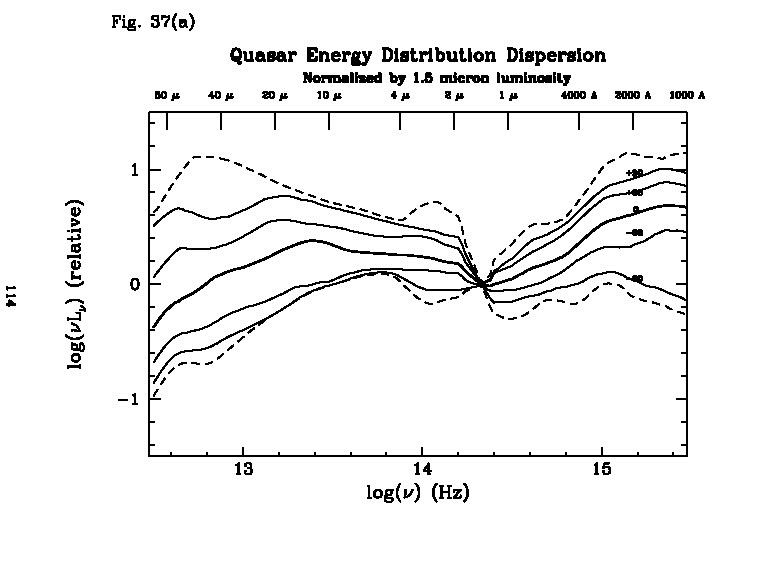
Fig 37 (a) The median quasar energy distribution in the UVOIR range, normalized at 1.5 microns, and the 68, 90, and 100 (dashed) Kaplan-Meier percentile envelopes, showing the large dispersion from the mean in the far infrared and ultraviolet.
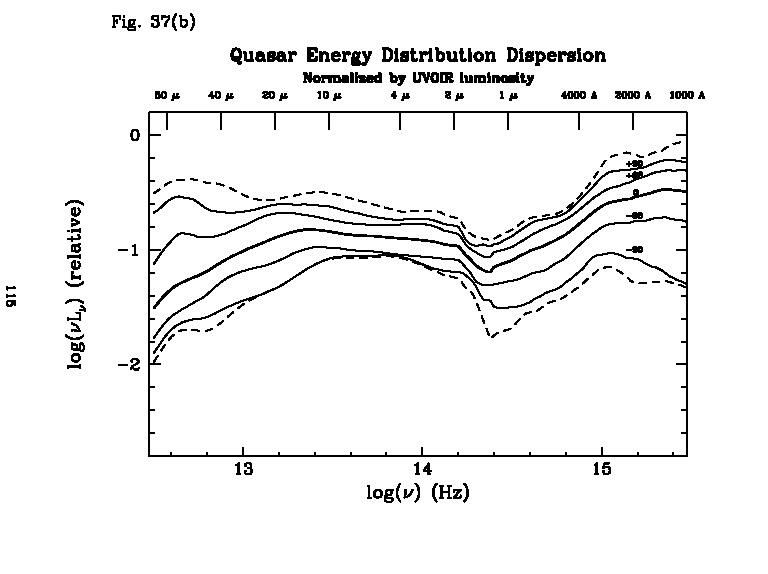
Fig 37(b) The median and percentiles when the energy distributions are normalized by their total 100 micron to 1000 A luminosity rather than the monochromatic 1.5 micron luminosity.