Section 5: Distribution of satellites above horizon vs latitude
These plots show the number of satellites above the horizon at a single moment and position, as a function of latitude. The satellites are not necessarily illuminated (we'll get to that in later sections).The blue line shows the total number of satellites, which is the sum of contributions from layer A (red), layer B (magenta), and layer C (green). See Section 2 for definitions of layers for each model.
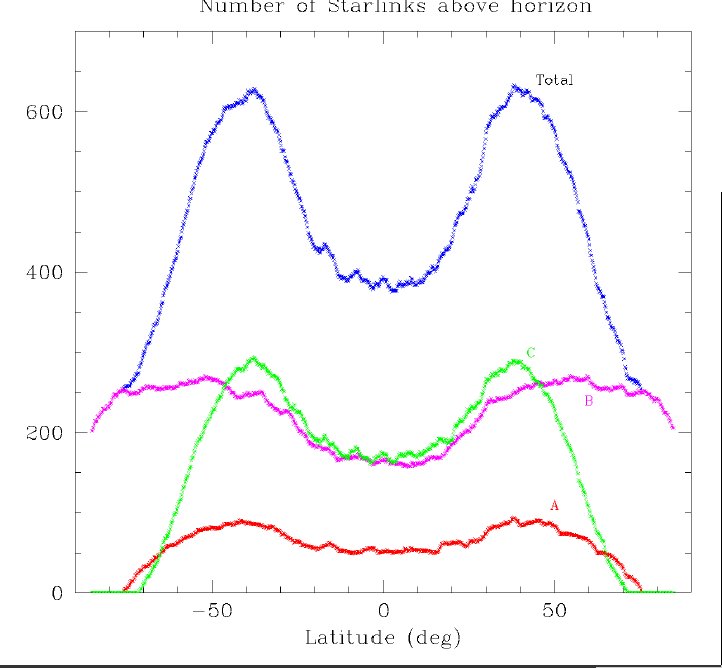
Realization of Starlink OLD (Model I) constellation, showing the varying density of satellites with latitude.
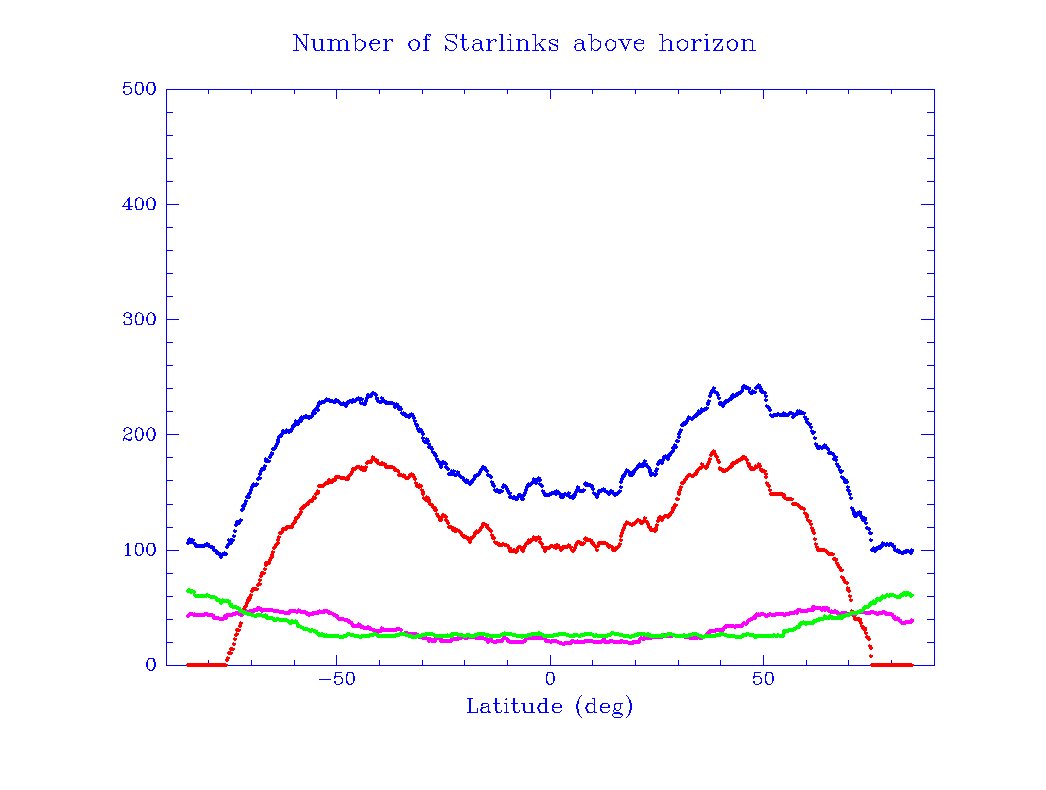
Realization of Starlink mod Gen1 (Model II) constellation, showing the varying density of satellites with latitude.

Realization of Starlink Gen2 (Model III) constellation, showing the varying density of satellites with latitude.
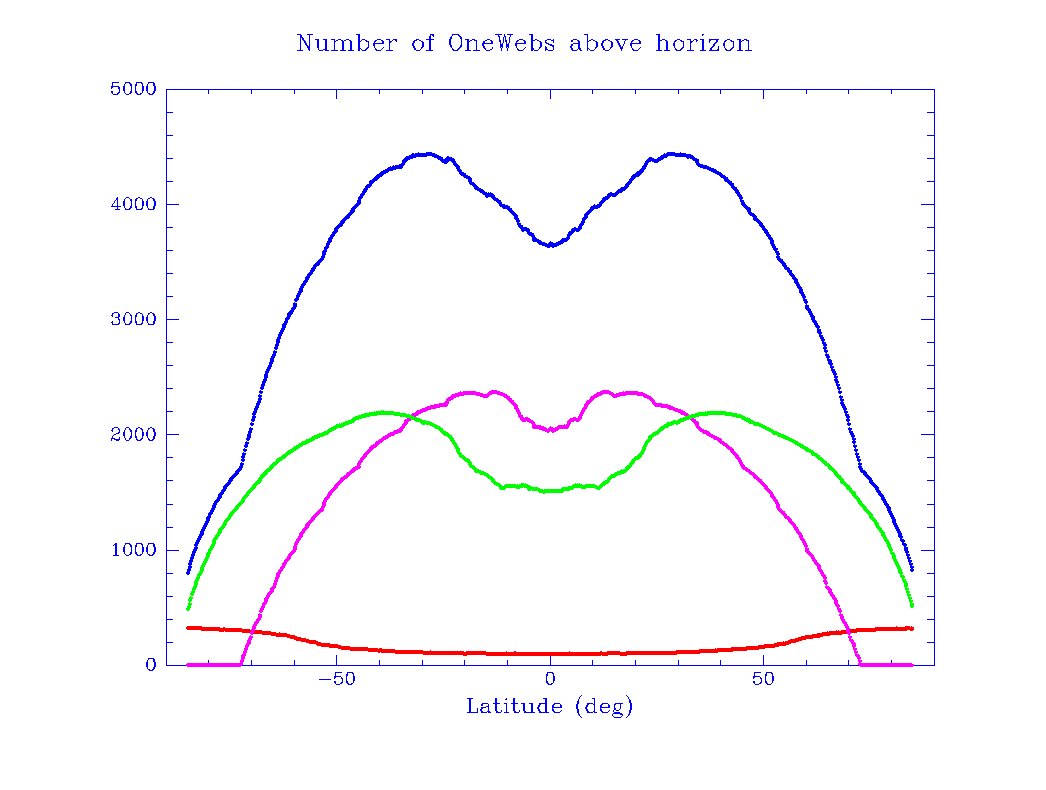
Realization of OneWeb Phase2 (Model IV) constellation, showing the varying density of satellites with latitude.
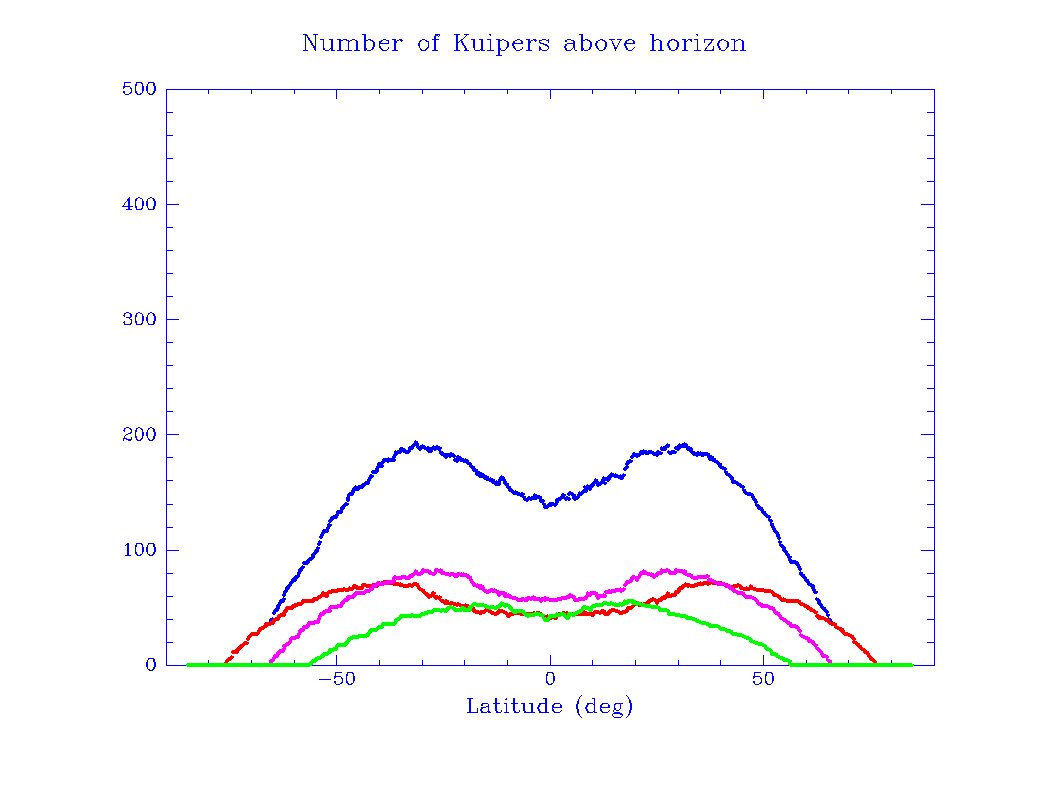
Realization of Kuiper (Model V) constellation, showing the varying density of satellites with latitude.