Prism
Prism is a file viewer within DS9. It was inspired by and replaces an earlier standalone program in the CIAO package.
Main Prism window
| Command: | prism open |
| Menu: | File - Prism |
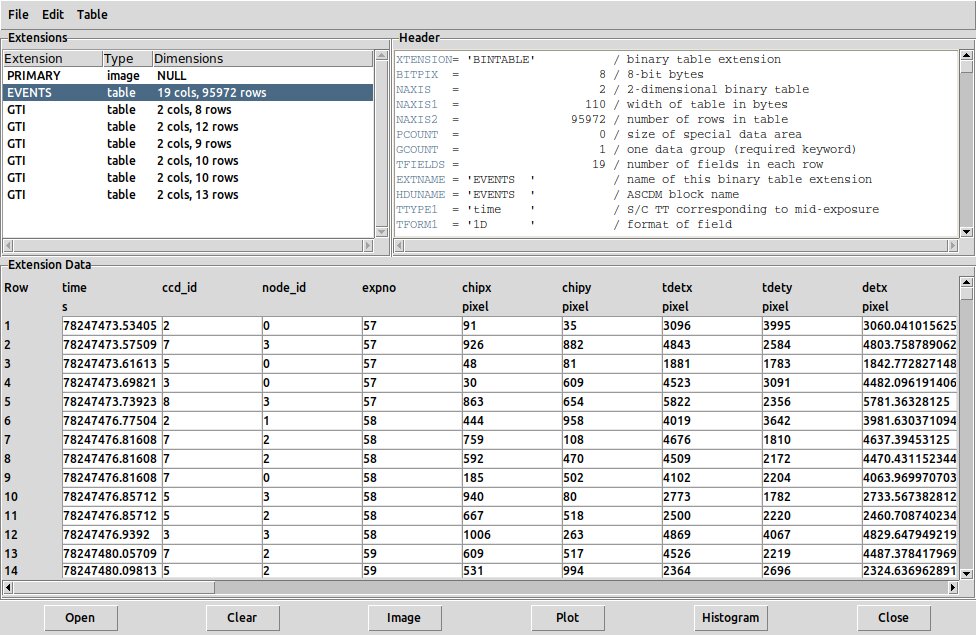
| Description: | opens a Prism browser and populates it with data from the current frame.On opening, the browser has four panes - a top left 'Extensions' pane showing the structure of the FITS file;a top right pane showing the header for the currently selected extension, anda main central pane (the data pane). If the extension is an image this pane is empty,but if it is a table the pane shows the data as rows and columns.Finally a menu pane at the bottom has a set of controls. |
Prism window for an event file
| Command: | prism open [filename] |
| Menu: | File - Prism - Open |
| Description: | opens a new dataset from disk. |
| Command: | prism clear |
| Menu: | File - Prism - Clear |
| Description: | clears all the Prism panes; a new dataset needs to be loaded. |
| Command: | prism close |
| Menu: | File - Prism - Close |
| Description: | closes the Prism window, but not the subsequently opened associated plot windows and control panels. |
| Command: | prism image |
| Menu: | File - Prism - Image |
| Description: | If you load a file into Prism (with File - Prism - Open), and it is an image (as opposed to a bintable), thatdoes not automatically render the image into the current display fram; you have to execute this command to display the image. |
| Command: | prism import xml|rdb|tsv [filename] |
| Menu: | File - Prism - Import - VOTable, Starbase, Tab-Separated-Value |
| Description: | imports tables in VOTable, Starbase, or TSV formats. |
| Command: | prism export xml|rdb|tsv [filename] |
| Menu: | File - Prism - Export - VOTable, Starbase, Tab-Separated-Value |
| Description: | saves the current Prism dataset in VOTable, Starbase, or TSV formats. |
| Command: | prism mode newplot|newgraph|overplot |
| Menu: | - |
| Description: | Controls whether the next plot is a new window or overplots the previous plot. |
| Command: | prism plot [xcol] [ycol] [xerr] [yerr] [opt] |
| Menu: | File - Prism - Plot |
| Description: | Creates a scatter plot from the data, as described below.The x and y columns are specified by name, and optionally x and y error colums. The opt string specifieswhich quantities x, y, ex (error on x), ey (error on y) are used; possible values are xy, xyex, xyey, xyexey. |
| Command: | prism histogram [xcol] [nbins] [min] [max] |
| Menu: | File - Prism - Histogram |
| Description: | Creates a histogram of the data, as described below. |
The top menu options File - Prism - Table - Plot and File - Prism - Table - Histogram do the same thing as the above two commands.
| Command: | prism first|last|next|previous |
| Menu: | File - Prism - Table - First|Last|Next|Previous Block |
| Description: | For a large table, only a subset or `block' of the data - by default, 1000 rows - is loaded into the data pane and is accessiblevia the X and Y scrollbars in the pane. These commandsallow the user to navigate to different sections of the extension data. |
| Command: | prism goto [n] |
| Menu: | File - Prism - Table - Goto Row |
| Description: | Navigate to given row of the data |
| Command: | prism current [text] |
| Menu: | - |
| Description: | Sets the name of the current Prism set to be [text] |
| Command: | prism ext [n] |
| Menu: | File - Prism - Extensions |
| Description: | Go to the specified HDU number. In the GUI, click on the desired HDUin the Extensions pane. |
| Command: | prism ext [extname] |
| Menu: | File - Prism - Extensions |
| Description: | Go to the HDU with the given value of EXTNAME. In the GUI, click on the desired HDUin the Extensions pane. |
Plot Tool
The Plot Tool has two variants, Line Plot and Bar Plot. They may be launched directly from DS9 by Analysis - Plot Tool - Line/Bar or from Prism by File - Prism - Plot. In the latter case the plot tool is connected to the table columns in the current Prism data table.
| Command: | plot line |
| Menu: | File - Prism - Plot |
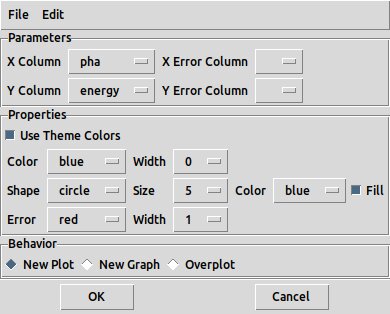
| Description: | launches a dialog which allows the user to make a scatter plot of onecolumn against another.The dialog provides the choice of X and Y columns, and optionally X and Y error columns (in the commandlanguage, described by the tokens 'xy', 'xyex', 'xyey', 'xyexey'). as wellas allowing control of plot point and error bar colors and width, and plot point shape, size and color.However, the 'Use Theme Colors' box in the plot dialog must be unchecked if colors are to be changed.The dialog also allows one to select New Plot (default, creates a new window), New Graph (adds a new plot withinthe existing plot window), or Overplot (on an existing plot). |
Prism plot dialog
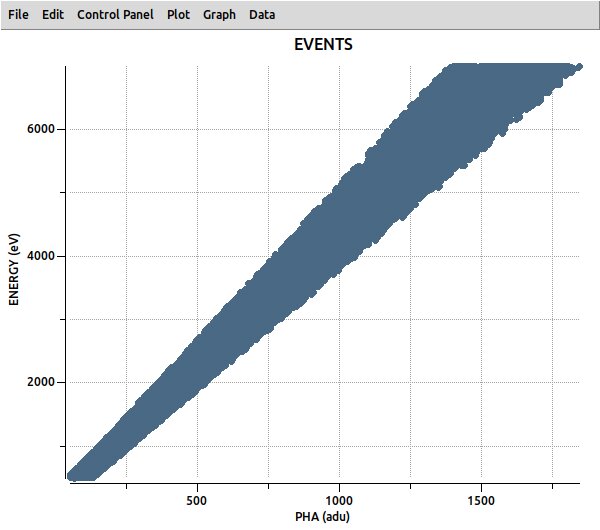
Prism plot of two event file columns against each other
| Command: | plot bar |
| Menu: | File - Prism - Histogram |
| Description: | brings up a dialog to create a histogram by binning a selected column.The dialog also permits specification of the min and maxdata values and the number of bins, as well as the border and fill color of the histogram bars.The user may select New Plot, New Graph or Overplot. |
Once File - Prism - Plot/Histogram - OK is selected, the dialog disappears and the plot window Prism Plot (or just Plot Tool if started from outside Prism) is created.
Other plot commands:
| Command: | plot line|bar [filename] [ref] [title] [xlabel] [ylabel] [xyexey] |
| Menu: | - |
| Description: | Create a newplot from a data file, optionally with given title, xlabel, ylabel. Specifywhat columns are in the file with 'xy', 'xyex', 'xyey', 'xyexey'. The resulting plot hasa top label of 'title' and a window title of 'ref'. The 'ref' is a title assigned by the userwhich can be used later to distinguish that specific plot when multiple ones are up. (see 'plot current') |
| Command: | plot line|bar [ref] stdin |
| Menu: | - |
| Description: | Create plot from stdin. The file streamed to stdin includes a one lineheader with space-separated fields of Title, X axis label, Y axis label, and the number N of data columns.Supported values of N are 2 (x and y), 3 (x, y and x error) and 4 (x, y and x and y errors).Example: 'cat stdin.2.dat | xpaset ds9 plot data xy' |
A suitable test plot file stdin.2.dat is
Title XAxis YAxis 2
0.00 0.153
80.00 0.021
160.00 0.008
240.00 0.007
320.00 0.007
400.00 0.006
480.00 0.006
560.00 0.006
640.00 0.005
720.00 0.005
| Command: | plot data [xyexey] |
| Menu: | - |
| Description: | Load new data into existing plot from stdin. Example: 'cat data.dat | xpaset ds9 plot data xy' |
| Command: | plot gui |
| Menu: | Plot Tool - Control Panel - Open |
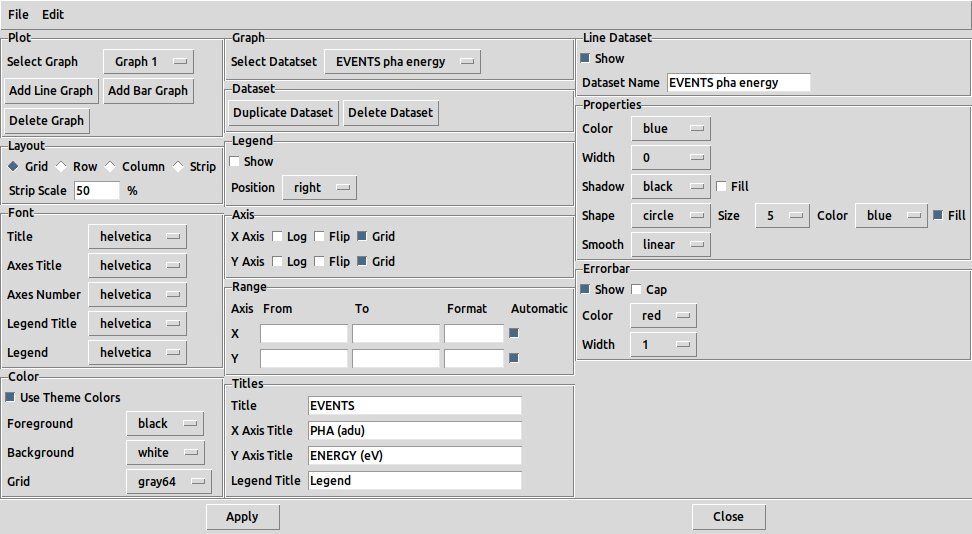
| Description: | Open the Plot Control Panel gui.Allows the user to modify the plot or graph oncecreated. It brings up a window that allows control of plot and graph properties and dataset properties. |
Plot control panel dialog
| Command: | plot close |
| Menu: | Plot Tool - close |
| Description: | Close the Plot Tool |
The Plot Tool window has additional menus as follows:
| Command: | plot backup|restore [filename] |
| Menu: | Plot Tool - Backup/Restore |
| Description: | saves the plot to a .plb script file,or restores the plot from such a file. The save procedure also creates a .plb.dir subdirectorycontaining the data and .plt format plot commands. |
| Command: | plot save [filename] |
| Menu: | Plot Tool - Save Data |
| Description: | dumps the x,y values to a text file with one line per x,y pair. |
| Command: | plot list yes|no |
| Menu: | Plot Tool - List Data |
| Description: | lists the x,y values in a new window with one line per x,y pair.The window has its own menu allowing you to print it, save it to a file, or change the font of the output values. |
| Command: | plot load [filename] [xyexey] |
| Menu: | Plot Tool - Load Data |
| Description: | allows you to load new data to be plotted froma text file with one line per x,y pair.Example: 'xpaset ds9 plot load foo.dat xy' |
| Command: | plot export eps|gif|tiff|jpeg|png [filename] |
| Menu: | Plot Tool - Export - EPS/GIF/TIFF/JPEG/PNG |
| Description: | saves the plot to a file in the selectedimage format. The jpeg and tiff cases have options: export jpeg [filename] [qualvalue], export tiff [filename] none/jpeg/packbits/deflate |
| Command: | plot mode pointer|zoom |
| Menu: | Plot Tool - Edit - Pointer/Zoom |
| Description: | In zoom mode, left button click-and-drag defines a rectangle to whichthe plot zooms in on when the button is released. Right button zooms out.In pointer mode, if the plot was created from a catalog (see Catalog Tool etc.) clicking on a data point in the plot will highlight thecorresponding row in the catalog table. |
| Command: | plot show yes|no |
| Menu: | Plot Tool - Data - Show |
| Description: | controls whether the data points are madevisible or not. |
| Command: | plot name [string] |
| Menu: | Plot Tool - Data - Name |
| Description: | brings up a dialog box where theuser can edit the plot dataset name, which is used in the plot legend. |
| Command: | plot current [ref] |
| Menu: | - |
| Description: | Make the named plot be the current plot.If multiple plots are up, you can refer to specific ones with a tag.Examples: xpaget ds9 plot current; xpaset -p ds9 plot current plot1prism.One can also use the commands 'plot current graph' and 'plot current dataset'. |
| Command: | plot line color|width [value] |
| Menu: | Plot Tool - Data - Color/Width |
| GUI Default: | Edit - Preferences - Plot - Dataset - Line - Color/Width |
| Description: | Allow the color and the width of the plotted line to be altered.In order to change the colors,Plot Tool - Plot - Use Theme Colors must be deselected first. |
| Command: | plot line dash yes|no |
| Menu: | Plot Tool - Data - Width - Dash |
| Description: | Control whether plot lines are dashed |
| Command: | - |
| Menu: | Plot Tool - Plot - Use Theme Colors |
| GUI Default: | Edit - Preferences - Plot - Use Theme Colors |
| Description: | Enforces use of theme colors.Deselect to allow controlling the color explicitly. |
| Command: | plot line shape symbol [value] |
| Menu: | Plot Tool - Data - Shape - Shape |
| GUI Default: | Edit - Preferences - Plot - Dataset - Shape |
| Description: | provides a submenu where differentpoint shapes may be selected: none, circle, square, diamond, plus, cross, splus ('simple plus'), scross ('simple cross'),triangle or arrow. Make sure the shape is not 'none' if you want to see the points and not just the line. |
| Command: | plot line shape size [value] |
| Menu: | Plot Tool - Data - Shape - Size |
| GUI Default: | Edit - Preferences - Plot - Dataset - Shape - Size |
| Description: | allows thesize of the data points to be altered. |
| Command: | plot line shape color [value] |
| Menu: | Plot Tool - Data - Shape - Color |
| GUI Default: | Edit - Preferences - Plot - Dataset - Shape - Color |
| Description: | allows thecolor of the data points to be altered. |
| Command: | plot line shape fill yes|no |
| Menu: | Plot Tool - Data - Shape - Fill |
| GUI Default: | Edit - Preferences - Plot - Dataset - Shape - Fill |
| Description: | controls whether the data points aredrawn filled or open. |
| Command: | plot line fill yes|no |
| Menu: | Plot Tool - Data - Shadow - Fill |
| GUI Default: | Edit - Preferences - Plot - Dataset - Shadow - Fill |
| Description: | Fill a solid color (shadow) axsbetween the line and the X axis |
| Command: | plot line fill color [value] |
| Menu: | Plot Tool - Data - Shadow - Color |
| GUI Default: | Edit - Preferences - Plot - Dataset - Shadow |
| Description: | provides a submenu whereshadow color can be selected. |
| Command: | plot line smooth [value] |
| Menu: | Plot Tool - Data - Smooth |
| Description: | has options step, linear, cubic, quadratic, catrom (Catmull-Rom spline) to control data smoothing.This determines how you draw the line going through the data points. Default is linear, but step may be more appropriate in some cases. |
| Command: | plot error yes|no |
| Menu: | Plot Tool - Data - Errorbar - Show |
| GUI Default: | Edit - Preferences - Plot - Errorbar - Show |
| Description: | controls whether errorbarsare drawn. |
| Command: | plot error cap yes|no |
| Menu: | Plot Tool - Data - Errorbar - Cap |
| GUI Default: | Edit - Preferences - Plot - Errorbar - Cap |
| Description: | controls whether errorbarsare drawn with caps (serifs) or not. |
| Command: | plot error color [value] |
| Menu: | Plot Tool - Data - Errorbar - Color |
| GUI Default: | Edit - Preferences - Plot - Errorbar - Color |
| Description: | allows you to select errobar color. |
| Command: | plot error width [value] |
| Menu: | Plot Tool - Data - Errorbar - Width |
| GUI Default: | Edit - Preferences - Plot - Errorbar - Width |
| Description: | allows you to select errobar width. |
| Command: | plot add graph line|bar |
| Menu: | Plot Tool - Add Graph - Line/Bar |
| Description: | adds a new graph to the plot, of either type Line or Bar. |
| Command: | plot current graph [label] |
| Menu: | Plot Tool - Select Graph |
| Description: | changes the currently selected graph, when multiple ones have been created. |
| Command: | plot delete graph |
| Menu: | Plot Tool - Delete Graph |
| Description: | deletes the current graph. |
| Command: | plot axis x|y log yes|no |
| Menu: | Plot Tool - Graph - X Axis/Y Axis - Log |
| GUI Default: | Edit - Preferences - Plot - Graph - X Axis/Y Axis - Log |
| Description: | controls whether the axis is or is not logarthmic, for the current graph. |
| Command: | plot axis x|y auto yes|no |
| Menu: | Plot Tool - Graph - Axes Range - X/Y - Automatic |
| Description: | Whether the X and Y axis ranges are autoscaled |
| Command: | plot axis x|y min|max [value] |
| Menu: | Plot Tool - Graph - Axes Range - X/Y - From|To |
| Description: | Explicitly set the X and Y axis ranges |
| Command: | plot axis x|y format [value] |
| Menu: | Plot Tool - Graph - Axes Range - X/Y - Format |
| Description: | Set the C format for displaying the axis numerics |
| Command: | plot axis x|y flip yes|no |
| Menu: | Plot Tool - Graph - X Axis/Y Axis - Flip |
| GUI Default: | Edit - Preferences - Plot - Graph - X Axis/Y Axis - Flip |
| Description: | controls whether the axis is flipped or not. |
| Command: | plot axis x|y grid yes|no |
| Menu: | Plot Tool - Graph - X Axis/Y Axis - Grid |
| GUI Default: | Edit - Preferences - Plot - Graph - X Axis/Y Axis - Grid |
| Description: | controls whether grid lines are plotted along the X or Y axes. |
| Command: | - |
| Menu: | Plot Tool - Plot - Grid |
| GUI Default: | Edit - Preferences - Plot - Grid |
| Description: | selects the color of the grid superimposed on the plot. |
| Command: | plot layout grid|row|column|strip |
| Menu: | Plot Tool - Plot - Layout - Grid, Row, Column, Strip |
| GUI Default: | Edit - Preferences - Plot - Layout |
| Description: | defines how the multiple graphs are laid out in the plot window. |
| Command: | plot layout strip scale [value] |
| Menu: | Plot Tool - Plot - Layout - Strip Parameters |
| Description: | allows a percentage value to control spacing of how the strips are plotted. |
| Command: | plot legend yes|no |
| Menu: | Plot Tool - Graph - Legend - Show |
| GUI Default: | Edit - Preferences - Plot - Graph - Show Legend |
| Description: | adds a legend to the current graph showing the different datasets and the colors used for them. |
| Command: | plot legend position right|left|top|bottom|plotarea |
| Menu: | Plot Tool - Graph - Legend - Right, Left, Top, Bottom, Plot Area |
| GUI Default: | Edit - Preferences - Plot - Graph - Legend Position |
| Description: | specifies where the legend is placed relative to the graph. |
| Command: | plot font title font|size|weight|slant [value] |
| Menu: | Plot Tool - Plot - Title |
| GUI Default: | Edit - Preferences - Plot - Title |
| Description: | controls the font, size, normal/bold state, and italic state of the plot title. |
| Command: | plot font labels font|size|weight|slant [value] |
| Menu: | Plot Tool - Plot - Axes Title |
| GUI Default: | Edit - Preferences - Plot - Axis Title |
| Description: | Controls axis title font info |
| Command: | plot font axes font|size|weight|slant [values] |
| Menu: | Plot Tool - Plot - Axes Number |
| GUI Default: | Edit - Preferences - Plot - Axis Numbers |
| Description: | Controls axis numbers font info |
| Command: | - |
| Menu: | Plot Tool - Plot - Legend Title |
| GUI Default: | Edit - Preferences - Plot - Legend Title |
| Description: | Controls legend title font info |
| Command: | - |
| Menu: | Plot Tool - Plot - Legend |
| GUI Default: | Edit - Preferences - Plot - Legend |
| Description: | Controls legend font info |
| Command: | plot title [string] |
| Menu: | Plot Tool - Graph - Titles - Title |
| Description: | allows the user to override the default values used for the text in the plot title |
| Command: | plot title x|y [string] |
| Menu: | Plot Tool - Graph - Titles - X|Y Axis Title |
| Description: | allows the user to override the default values used for the text in the X axis and Y axis labels |
| Command: | - |
| Menu: | Plot Tool - Graph - Titles - Legend Title |
| Description: | allows the user to override the default values used for the text in the legend title (default: "Legend"). |
| Command: | - |
| Menu: | Plot Tool - Plot - Foreground |
| GUI Default: | Edit - Preferences - Plot - Foreground |
| Description: | selects the color of all of Title, Axes Title, Axes Number. |
| Command: | plot background [color] |
| Menu: | Plot Tool - Plot - Background |
| GUI Default: | Edit - Preferences - Plot - Background |
| Description: | selects the color of the background of the plot window. |
| Command: | plot current dataset [tag] |
| Menu: | Plot Tool - Graph - Dataset |
| Description: | selects the current dataset from those already loaded. |
| Command: | plot duplicate |
| Menu: | Plot Tool - Graph - Duplicate Dataset |
| Description: | makes a copy of the current dataset and adds it to the dataset list. |
| Command: | plot delete dataset |
| Menu: | Plot Tool - Graph - Delete Dataset |
| Description: | deletes the current dataset. |
| Command: | - |
| Menu: | Plot Tool - Data - Show |
| Description: | may be unselected to make the data points invisible. |
| Command: | plot stats yes|no |
| Menu: | Plot Tool - Statistics |
| Description: | brings up a window listing themin, max, mean, median, variance and standard deviation of the Y values from the plot.The window has its own menu allowing you to print it, or change the font of the output values. |
| Command: | plot bar color [value] |
| Menu: | Edit - Preferences - Plot - Bar Dataset - Color |
| Description: | sets the bar color for a bar plot |
| Command: | plot bar width [value] |
| Menu: | Edit - Preferences - Plot - Bar Dataset - Width |
| Description: | sets the bar width for a bar plot |
| Command: | plot bar fill yes|no |
| Menu: | Edit - Preferences - Plot - Bar Dataset - Fill |
| Description: | sets/unsets the bar fill flag. |
| Command: | plot bar border color [value] |
| Menu: | Edit - Preferences - Plot - Bar Dataset - Border |
| Description: | sets the border color for a bar plot |
| Command: | plot bar border width[color] |
| Menu: | Edit - Preferences - Plot - Bar Dataset - Border - Width |
| Description: | sets the border width for a bar plot |
| Command: | plot print |
| Menu: | Plot Tool - File - Print |
| Description: | Print the plot |
| Command: | plot print destination printer|file |
| Menu: | Plot Tool - File - Printer|File |
| Description: | Select destination for plot print |
| Command: | plot print [filename] |
| Menu: | Plot Tool - File - Print - Name |
| Description: | Select output filename for plot |
| Command: | plot print command [text] |
| Menu: | Plot Tool - File - Print - Command |
| Description: | Print command (e.g. 'lp -Pfoo' |
| Command: | plot print color rgb|gray |
| Menu: | Plot Tool - File - Print - Postscript |
| Description: | Select color or gray for print |
| Command: | plot pagesetup orient|scale|size |
| Menu: | Plot Tool - File - Page Setup |
| Description: | The pagesetup commands are also available within in plot |