Scale and Color
The following sections discuss the range and scaling of the displayed pixel values.
Color visuals
The default color environment for DS9 for modern devices is usually the 'truecolor24' visual, 24-bit RGB colors. In principle you can override the visual with a command line option:
ds9                      # default visual, default depth
ds9 -visual true         # true color, default depth
ds9 -visual truecolor    # true color, default depth
ds9 -visual truecolor8   # true color 8-bit
ds9 -visual truecolor16  # true color 16-bit
ds9 -visual truecolor24  # true color 24-bit
It is unlikely you will need to do this.
In more detail:
DS9 supports a number of color environments. Not all color environments, or visuals, are available on most machines. In fact, you may be restricted to one or two, based on the color graphics hardware your computer has. A color visual is composed of two parts, the color model and the bit depth. True color uses the value directly as a RGB triplet, to derive the correct color.
You can use the xdpyinfo command to see if one of these visuals are available. NOTE: Linux Users-- if your desired visual is not available, use the Xconfigurator command (Red Hat) or similar command under other versions of linux, to configure your X window visuals.
When DS9 is invoked, by default, it will use the default visual. You can find out what the default visual is by using the xdpyinfo command. You can also force DS9 to use another visual by a command line option. If you specify a visual, and it is not available, DS9 will exit with an error message.
Main window pixel values
The RGB pixel value (r,g,b) displayed in DS9 for a given image pixel is an RGB-valued function F(x) of the pixel value (x) in the data, the color table C1(i), (i = 1, N1), the min/max pixel scale limits x1 to x2, the color stretch a and bias b, a scaling function s(r), and an intermediate array size N. The value of N1 is typically of order 200 and N is 16384.
- We define the base color table function as
c(y) = {
C_1(1) (y < 1 ) C_1(intint(y)) ( 1 <= y <= N_1 ) C_1(N_1) (y > N_1 )
. - We define the dimensionless integer-valued variable ̂r as
̂r = intint(( x - x_1 / x_2 - x_1 ) ) and its real-valued counterpart r = ̂r / N
- and then index into the color table with F(x) = c(y) where y = N_1 ( as(r) + t ) and the offset t depends on the contrast and bias via t = 1/ 2( 1 - a(b+0.5) )
This gives us the RGB triple F displayed for a given pixel value x.
Note that there are N possible values of r and thus y, and so c(y) is implemented as an array of N color triples.
With the default values of a=1.0, b=0.5 and s linear, this reduces to t=0 and F(x) = c( (N_1/N) ̂r ) corresponding to a simple rebinning of the color map from N1 to N bins.
Color tags
However DS9 also supports `color tags' which modify the F(x) function. Each tag Tj defines a range of pixel values xjminmin to xjmaxmax and a replacement RGB color C'J so that F(x) = C^'_J for the range xjminmin <= x <= xjmaxmax
The purpose of color tags are to highlight (or hide) certain values of data, regardless of the color map selected. The user creates, edits, and deletes color tags via the GUI.
To define a color tag, select Edit - Colorbar mode, then double-left-click in the colorbar. This defines a new color tag and pops up a dialog which allows the color C'J to be selected by name from a list of available colors, and xjminmin, xjmaxmax to be specified numerically.
| Command: | cmap open |
| Menu: | Color - Colormap Parameters |
| Description: | Open the Colormap Parameters dialog. |
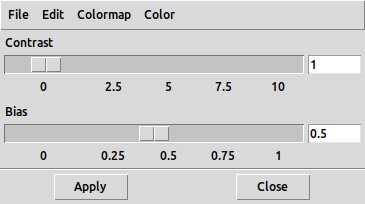
Colormap Parameters dialog
| Command: | cmap close |
| Menu: | Color - Colormap Parameters - Close |
| Description: | Close the Colormap Parameters dialog. |
| Command: | cmap tag save [filename] |
| Menu: | Color - Colormap Parameters - Save Color Tags |
| Description: | Save color tags defined for current frame. |
| Command: | cmap tag load [filename] |
| Menu: | Color - Colormap Parameters - Load Color Tags |
| Description: | Loads a tags file saved earlier. |
| Command: | cmap tag delete |
| Menu: | Color - Colormap Parameters - Delete Color Tags |
| Description: | Deletestags currently defined in the frame. |
| Command: | - |
| Menu: | Color - Colormap Parameters - Color |
| GUI Default: | Edit - Preferences - Color - Colorbar - Tag color |
| Description: | Menu allows the user to preselect the color that will be used when anew color tag is selected. |
| Command: | - |
| Menu: | Color - Colormap Parameters - Download colormap |
| Description: | takes you to a web page where you can find an index tovarious extra colormaps. Click through to find one you like, selecting ones with 'sao' or 'lut' filetype.This opens a new frame with a picture of the colormap. You can load an image into this frame.On reading a colormap:A .lut file is assumed to be a XImtool/SAOtng format colormap.A .sao file is assumed to be a DS9/SAOImage format colormap.Any other filename extension is assumed to be a DS9 format one. |
| Command: | cmap save [filename] |
| Menu: | Color - Colormap Parameters - File - Save |
| Description: | Save the colormap in .sao format. |
| Command: | cmap load [filename] |
| Menu: | Color - Colormap Parameters - File - Open |
| Description: | Load a colormap. |
Detailed derivation
In more detail: We have an rgb-valued color scale C(r) that maps an integer r from 1 to N ( N =16384) to a color triple.
The color scale is constructed as follows. We read a base colormap file C1(i), i = 1 to N1, where typically N1 is of order 200.
The base colormap is stretched to an array C2 of size N2=4096 by C_2(j) = C_1( (N_1/N_2) j ) We then apply a contrast a to stretch the array values (but in a same size array N3=N2) C_3(j) = C_2( N_2/2 + (j-N_2/2)*a ) and a bias b (valued 0 to 1) to give array C4, of size N4=N3=N2, C_4(j) = C_3(j-(b-0.5)*N_2/2) We now stretch again to size N=16384 C_5(j) = C_4(j*N_4/N) and apply a nonlinear scale function s(x), C(j) = C_5(N s(j/N)) = C_4(N_4 s(j/N) so that
| C(j) | = | C_5(N s(j/N)) |
| = | C_4(N_4 s(j/N)) | |
| = | C_3(N_4 s(j/N) - (b-0.5)*N_2/2) | |
| = | C_2(N_2/2 + a*(N_4 s(j/N) - (b-0.5)*N_2/2 - N_2/2)) | |
| = | C_1( (N_1/N_2) * ( N_2/2 + a * ( N_4 s(j/N) - (b-0.5)*N_2/2 - N_2/2) )) |
Or C(j) = C_1(k) where k = (N_1/2 + a N_1 s(j/N) - a (( b + 0.5 ) * N_1/2)) or k/N1 = (a s(j/N) + (1-a(b+0.5))/2
So for a = 1, b = 0.5, s= 1 we have k = N1 j/N as expected.
The contrast and bias a and b can be set in the Color - Colormap Parameters dialog:
| Command: | cmap [a] [b] |
| Menu: | Color - Colormap Parameters - Contrast/Bias |
| Description: | Set contrast and bias values: example: cmap 5 0.5 |
The two floating point values a and b can be saved in a text file with Color - Colormap Parameters - Save Contrast/Bias, and restored from that file with Color - Colormap Parameters - Load Contrast/Bias.
Supported scaling functions
The scaling functions are:
| linear | Linear | s(r) = r |
| log | Log | s(r) = pr+1)/p) , for a parameter p whose default is 1000. |
| power | Power | s(r) = (pr-1 / p ), for parameter p with default 1000. |
| sqr | Sq Root | s(r) = √rr |
| sqr | Squared | s(r) = r2 |
| asinh | asinh | s(r) = sinh-1(pr)/3, where p = 10. |
| sinh | sinh | s(r) = sinh(3r/p), where p = 10. |
| histeq | Histeq | with s(r) depending on the frequency of each r value. |
| logexp | Log exponent |
| Command: | scale [function] |
| Menu: | Scale - [function] |
| Description: | Allows the user to select which scaling function s(r) is used.For example, 'xpaset -p ds9 scale asinh' On the command line, one can use the functions as options directly,so 'ds9 -linear', 'ds9 -log', etc. |
| Command: | scale log exp [value] |
| Menu: | Edit - Preferences - Scale - Log Exponent |
| Description: | Controls the value of p in the log and power functions |
Calculating scale range limits
| Command: | scale open |
| Menu: | Scale - Scale Parameters |
| Description: | Generates a popup dialog which allows the user to enterthe x1 and x2 values explicitly. The Scale menu alsolets the user specify one of several range limit algorithms to calculate and apply suitable values. |
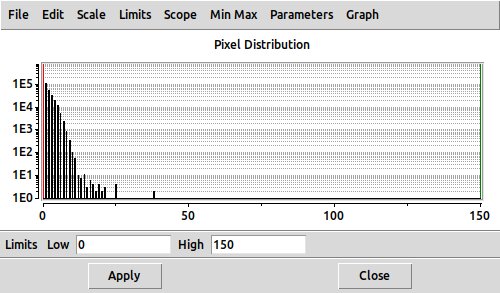
Scale parameters dialog
| Command: | scale close |
| Menu: | Scale - Scale Parameters - Close |
| Description: | Closes the dialog |
| Command: | scale limits [min] [max] |
| Menu: | Scale - Min Max |
| Description: | Min Max: use the minimum and maximum values in the data. |
| Command: | - |
| Menu: | Scale - Scale Parameters - Preset Percentiles |
| Description: | Set the min and max values using the Xth percentile of the distributionof data values. The user can select X = 99.5, 99, 98, 97, 96, 95, 92.5 or 90. |
| Command: | scale mode [X] |
| Menu: | Scale - Other - [X] |
| Description: | Set the min and max values using the Xth percentile of the distribution of data values. |
| Command: | zscale |
| Menu: | Scale - Zscale (1) |
| Description: | The first Scale - ZScale menu entry selects this algorithm.ZSCALE is an algorithm inherited from IRAF.The algorithm has three parameters: Contrast (C), Number of Samples (N), and Samples per Line (L). |
| Command: | scale mode zscale |
| Menu: | Scale - Zscale (1) |
| Description: | Apply Zscale algorithm.The algorithm defines a sample of N pixels evenly spaced in x and y (sofor example if N=36, L = 6 and the image is 50 x 50, then the pixels selected wouldbe spaced 10 apart, starting with (1,1), (11,1), (21,1) ... and ending with (50,50), more or less.The values of those pixels are sorted to provide a monotonicincreasing array V(i), i = 1,N, and the midpoint m = N/2 of this arrayis the median M = V(m).A line of slope S is fit to the V(i) curve, rejecting poorly fitting points near i=1 and i=N usingan iterative approach.We then setx_1 = V(m) + (S/C)(1-m)andx_2 = V(M) + (S/C)(N-m) |
| Command: | - |
| Menu: | Scale - Zscale (2) |
| Description: | The second Scale - ZScale menu pops up a Scale - ZScale - ZScale Parameters dialog where the ZScaleC, N and L parameters can be changed. |
These can also be set with
| Command: | zscale contrast [value] |
| Menu: | Edit - Preferences - Scale - ZScale Parameters - Contrast |
| Description: | Sets default contrast scale for ZScale |
| Command: | zscale sample [value] |
| Menu: | Edit - Preferences - Scale - ZScale Parameters - Number of Samples |
| Description: | Sets default number of samples for ZScale |
| Command: | zscale line [value] |
| Menu: | Edit - Preferences - Scale - ZScale Parameters - Samples per Line |
| Description: | Sets default samples per line for ZScale |
| Command: | scale mode zmax |
| Menu: | Scale - Zmax |
| Description: | ZMAX: uses the x1 value calculated by the ZScale algorithm and sets x2to the max value of the data. |
| Command: | - |
| Menu: | Scale - User |
| Description: | This menu entry is checked if the user has entered explicit low, high values in Scale Parameters. If you then change to another scale method (e.g. Scale - Zscale),subsequently selecting Scale - User will remember and restore the most recent user-selected low-high values. |
| Command: | scale mode minmax |
| Menu: | Scale - MinMax |
| Description: | Specify methods tosample only a subset of the data to determine the min/max. The default, Scan, usesall the data. Sample uses only every nth data point, where n can be set in theScale - MinMax - SampleParameters dialog.If the FITS header keywords DATAMIN/DATAMAXor IRAF-MIN/IRAF-MAX are present in the file header, these may also be chosen to setthe min/max values. |
| Command: | minmax mode scan|sample|datamin|irafmin |
| Menu: | Scale - Scale Parameters - Min Max - Scan|Sample|DATAMIN|IRAFMIN |
| GUI Default: | Edit - Preferences - Scale - Min Max Parameters - Sample Increment |
| Description: | Determine min max by scanning all data, sampling every N values,using the DATAMIN keyword if present, using the IRAFMIN keyword if present. |
| Command: | minmax interval [n] |
| Menu: | Scale - Scale Parameters - Min Max - Sample Parameters |
| Description: | Set the sampling interval for the 'minmax mode sample' option. |
| Command: | minmax rescan |
| Menu: | - |
| Description: | Rescan the data for minmax values |
| Command: | scale dataset yes|no |
| Menu: | Scale - DATASEC |
| Description: | By default, if the DATASEC keyword is present in the header, its value is used todetermine what subset of the data is considered valid data for min/max calculationsand for display.The value of this NOAO/IRAF keyword is a string of the form `[x1:x2,y1:y2]', forexample `[13:628,1:568]'.This command is used to enable or disable DS9's use of this keywordto filter the data. |
Selecting and overriding the colormap
A wide selection of colormaps are provided by DS9. These are selected by the Color menu entries:
| Command: | cmap [value] |
| Menu: | Color - [value] |
| Description: | Select colormap. |
The color menu also supports the functions
| Command: | cmap invert yes|no |
| Menu: | Color - Invert colormap |
| Description: | Inverts the colormap |
| Command: | - |
| Menu: | Color - Reset colormap |
| Description: | Reset colormap to original state |
It is possible to override sections of the colormap by defining 'color tags'.
Colorbar
| Command: | colorbar numerics yes|no |
| Menu: | Color - Colorbar - Numerics - Show |
| Description: | Displays numerical values along each colorbar (on by default). |
| Command: | colorbar ticks [value] |
| Menu: | Color - Colorbar - Number of Ticks |
| GUI Default: | Edit - Preferences - Color - Colorbar - Number of Ticks |
| Description: | The number of values displayed is controlled, but only approximately, by this command |
| Command: | colorbar space value|distance |
| Menu: | Color - Colorbar - Numerics - Space Equal Value|Distance |
| Description: | If Space Equal Value is set, the values displayed are equally spaced in value x.If Space Equal Distance is set, the values displayed are for points in the colorbar an equaldistance apart in scaled value F(x) on the displayed colorbar. This is the default and usuallymakes more sense when a logarithmic scale is selected. |
| Command: | colorbar font [value] |
| Menu: | Color - Colorbar - Font |
| Description: | Controls the font of the colobar numeric labels - e.g. 'colorbar font times' |
| Command: | colorbar fontslant roman|italic |
| Menu: | Color - Colorbar - Font - Style |
| Description: | Controls the font style (roman or italic) of the colobar numeric labels |
| Command: | colorbar fontsize [value] |
| Menu: | Color - Colorbar - Font - Size |
| Description: | Controls the font size of the colobar numeric labels |
| Command: | colorbar fontweight normal|bold |
| Menu: | Color - Colorbar - Font - Normal|Bold |
| Description: | Controls the font weight of the colobar numeric labels |
| Command: | colorbar size [value] |
| Menu: | Color - Colorbar - Size |
| GUI Default: | Edit - Preferences - Color - Colorbar - Colorbar size |
| Description: | Allows you to enter a size for the thickness of the colorbars.Changes applied in the Color - Colorbar menu affect all the displayed colorbars for all the frames. |
| Command: | mode colorbar |
| Menu: | Edit - Colorbar |
| Description: | In Colorbar mode, the left button has the same function as the right button, controlling colorbar bias and contrast. |