Profile Graphs
| Command: | view graph horizontal|vertical yes|no |
| Menu: | View - Horizontal|Vertical Graph |
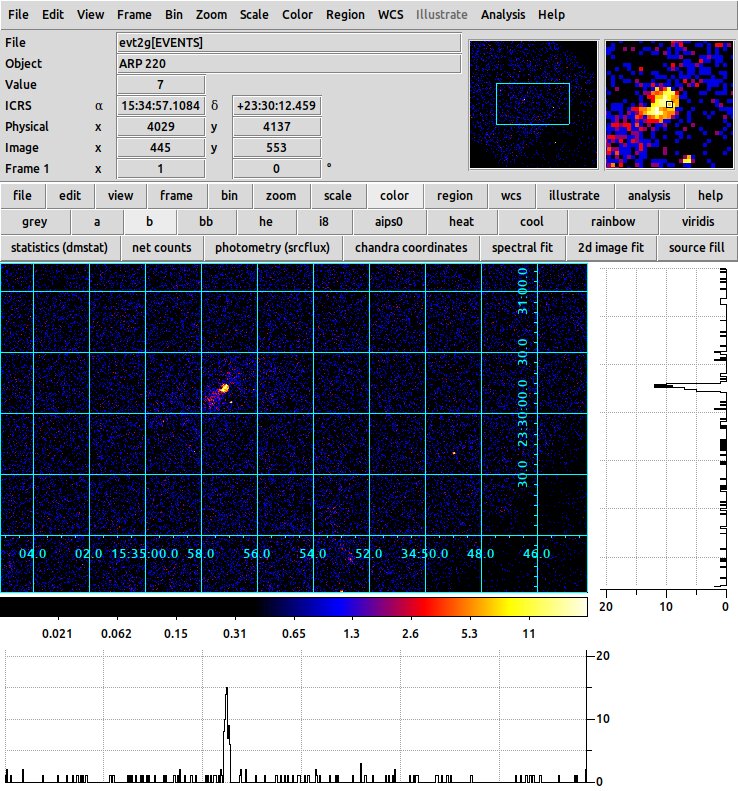
| Description: | If either or both of these options are set, a graph is added at theside of the main windowwhich shows, and dynamically updates, 1D sections in x or y passing through the current x,y position. |

Horizontal and vertical graphs
| Command: | graph open|close |
| Menu: | Analysis - Graph Parameters |
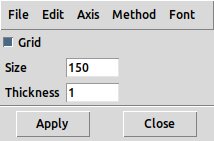
| Description: | Opens the Graph Parameters dialog. |

Graph Parameters dialog
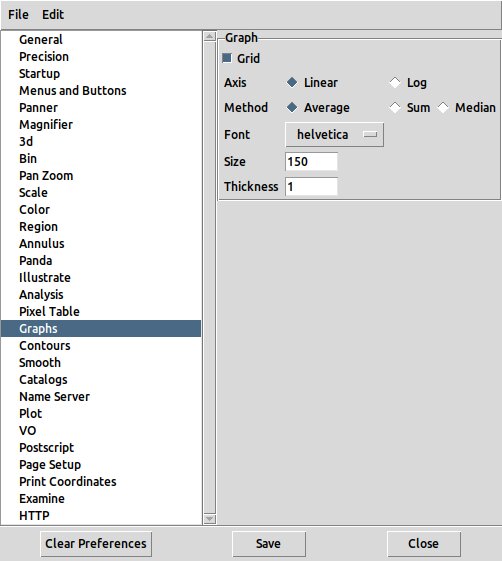
The graph parameters menu controls aspects of the graph, and the Preferences - Graphs menu controls the defaults at startup.

Edit Preferences - Graphs dialog
| Command: | graph grid yes|no |
| Menu: | Analysis - Graph Parameters - Grid |
| GUI Default: | Edit - Preferences - Graphs - Grid |
| Description: | Displays a grid |
| Command: | graph log yes|no |
| Menu: | Analysis - Graph Parameters - Axis - Linear/Log |
| GUI Default: | Edit - Preferences - Graphs - Axis - Linear/Log |
| Description: | Controls whether or not the y axis is logarithmic. |
| Command: | graph method average|sum |
| Menu: | Analysis - Graph Parameters - Method - Average/Sum/Median |
| GUI Default: | Edit - Preferences - Graphs - Method - Average/Sum/Median |
| Description: | Controls how the y value is calculated in the extraction region. |
| Command: | graph font [value] |
| Menu: | Analysis - Graph Parameters - Font |
| GUI Default: | Edit - Preferences - Graphs - Font |
| Description: | Controls the font for the axis numerics. |
| Command: | graph fontsize [value] |
| Menu: | Analysis - Graph Parameters - Font - Size |
| Description: | Controls the font for the axis numerics. |
| Command: | graph fontweight [value] |
| Menu: | Analysis - Graph Parameters - Font - Weight |
| Description: | Controls the font for the axis numerics. |
| Command: | graph fontslant [value] |
| Menu: | Analysis - Graph Parameters - Font - Slant |
| Description: | Controls the font for the axis numerics. |
| Command: | graph size [value] |
| Menu: | Analysis - Graph Parameters - Size |
| GUI Default: | Edit - Preferences - Graphs - Size |
| Description: | controls the height (for horizontal) or width (for vertical) of the space used by the graph. |
| Command: | graph thickness [value] |
| Menu: | Analysis - Graph Parameters - Thickness |
| GUI Default: | Edit - Preferences - Graphs - Thickness |
| Description: | Controls the thickness in pixels of the projection section used to calculate the graph values. Default is 1. |
| Command: | - |
| Menu: | Analysis - Graph Parameters - Apply |
| Description: | Applies any GUI changes made to the graph parameters menu. |